[Tableau] London Bike Rides

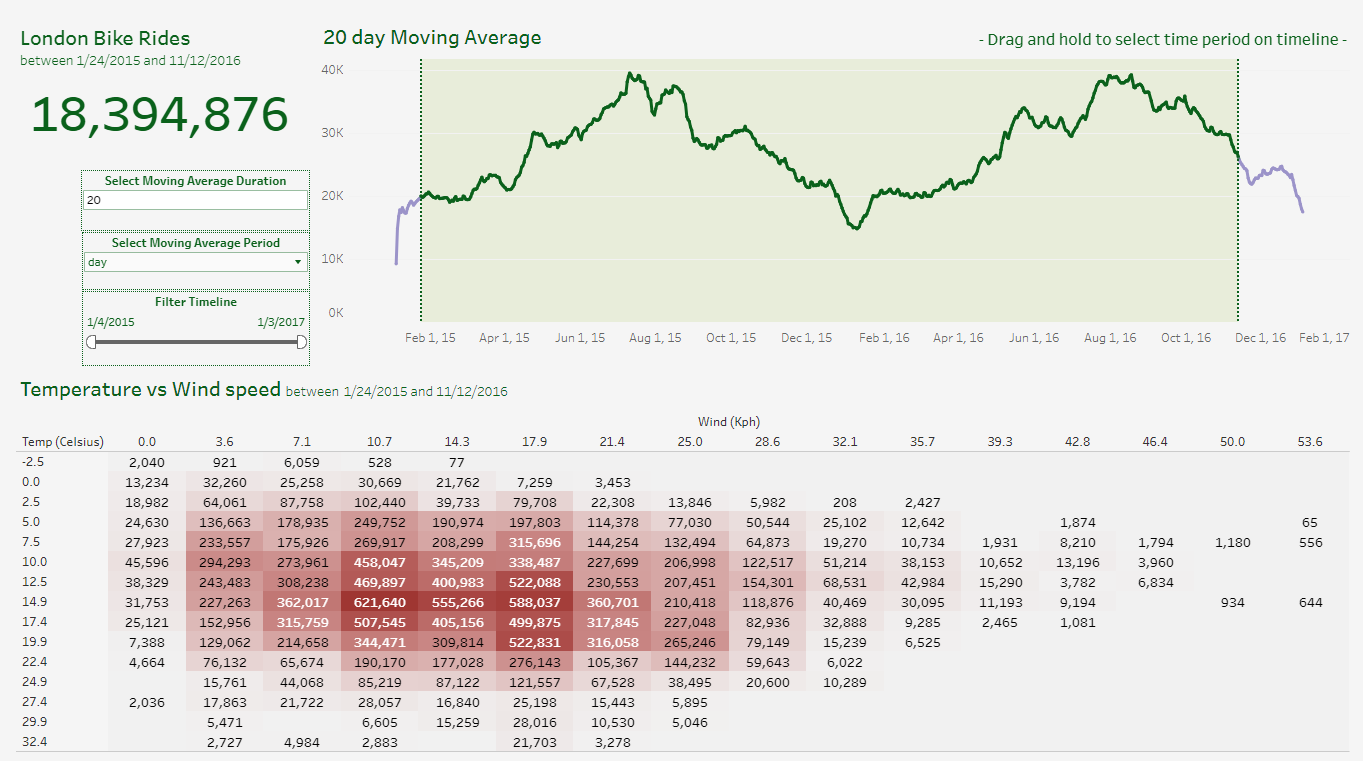
Python pandas library used for data preparation of London Bike Rides, and presented a dashboard.
- Displayed five visualizations including moving average charts with parameters.
- Implemented filters for detailed exploration.
- Included a heatmap showing ride counts sorted by wind speed and temperature.
- Added two additional visualizations - rides by weather, and rides by length.
[Power BI] Data-Professionals Survey

600 data-related professionals survey response dashboard in Microsoft Power BI.
- Utilized treemap to allow users to filter by country.
- Visualized average salary by job title using stacked bar charts.
- Represented favorite programming languages per job title using stacked column charts.
- Displayed personal difficulty ratings for each job title using donut charts.
- Showcased average salary and work-life balance using Gauges.
- Included cards to represent core informations.
- Analyzed salary by age and gender with line charts.
[Tableau] Seattle Airbnb

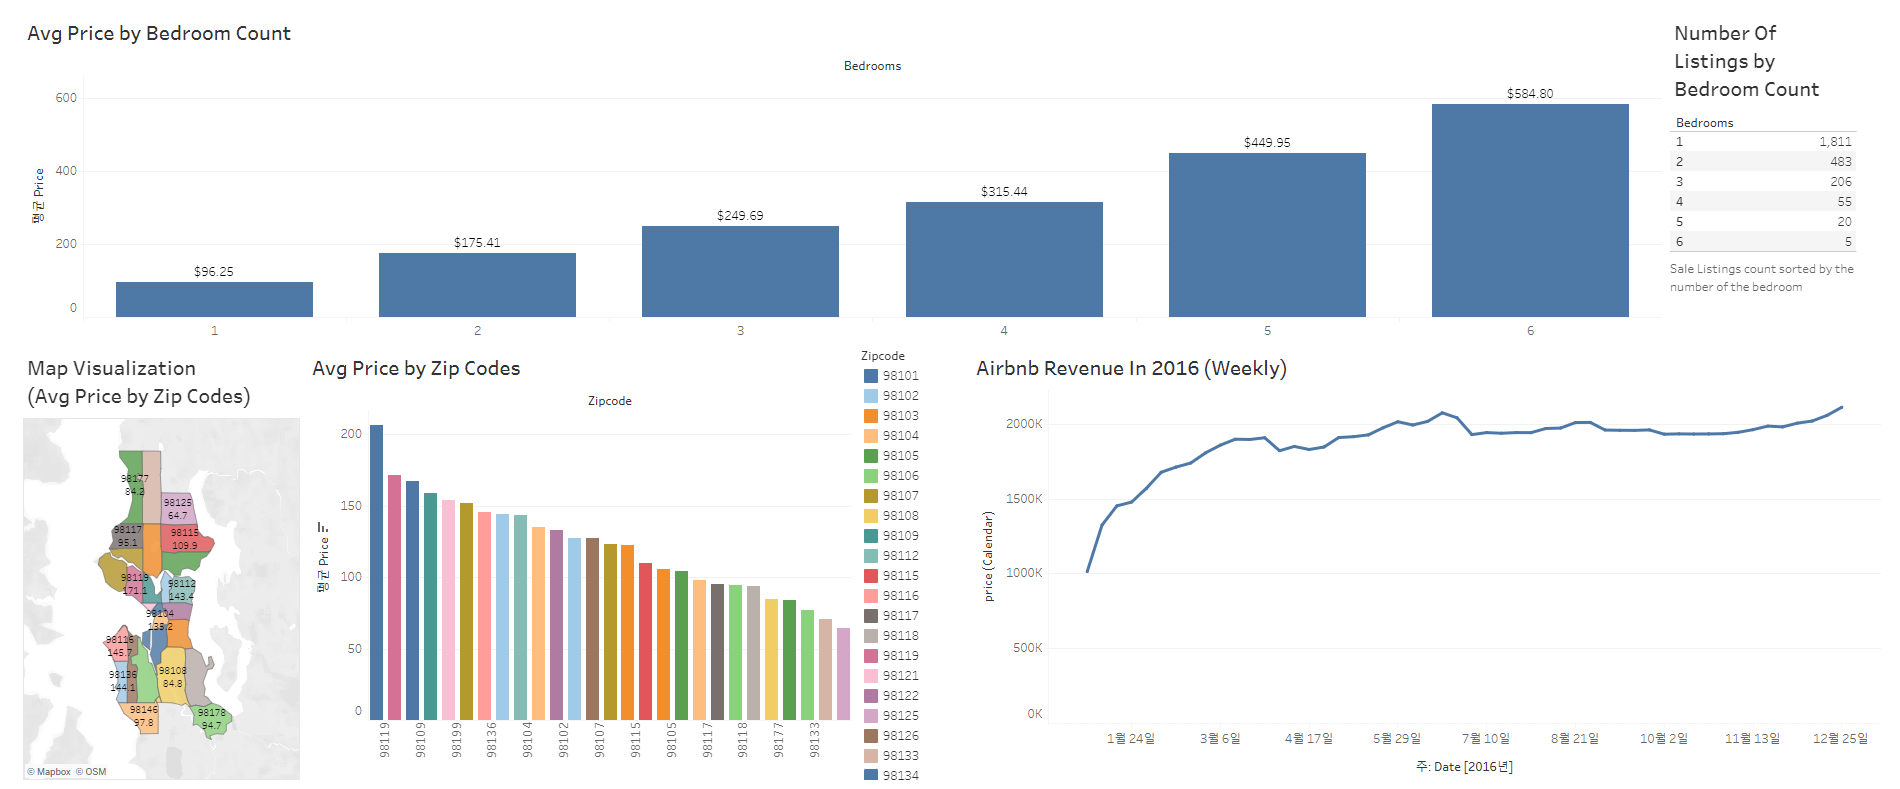
Geographical Cost analysis dashboard on Seattle Airbnb data.
- Explored the relationship between the number of bedrooms and cost per night.
- Presented the average cost of Airbnb stays within Seattle by zip code.
- Calculated total weekly Airbnb revenue in Seattle.
- Visualized the number of Airbnb listings grouped by bedroom count.
[Excel] Worldwide Bike Sales

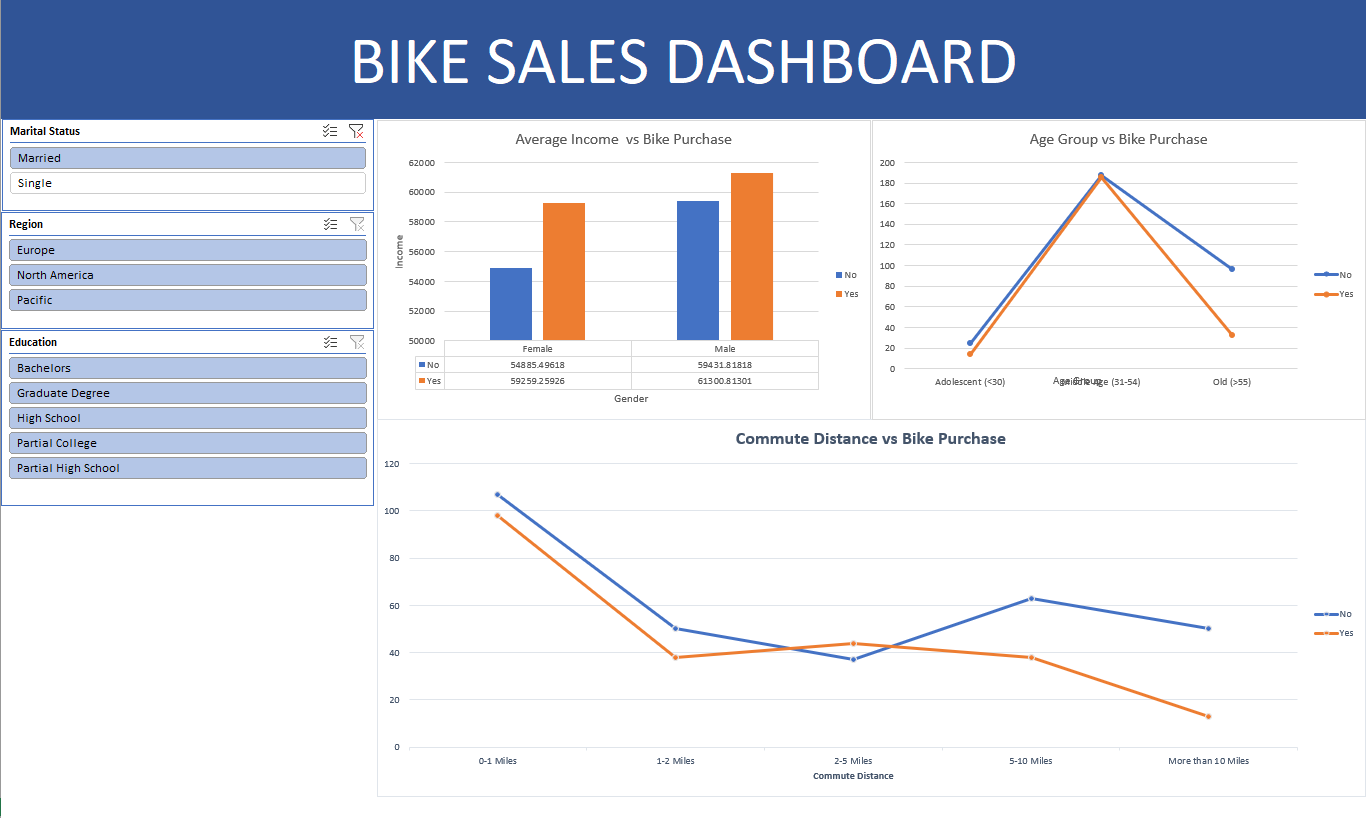
Cleaned EU/NA/Pacific Bike Sales data with Excel and showcased with a dashboard.
- Removed duplicate rows and populated marital status column.
- Created age bin column using nested if statements.
- Utilized pivot tables with slicers for data filtering.
- Illustrated the relationship between average income and bike purchases with a column chart.
- Analyzed bike purchases across different age groups using a line chart.
- Explored the impact of commute distance on bike purchases with a line chart.